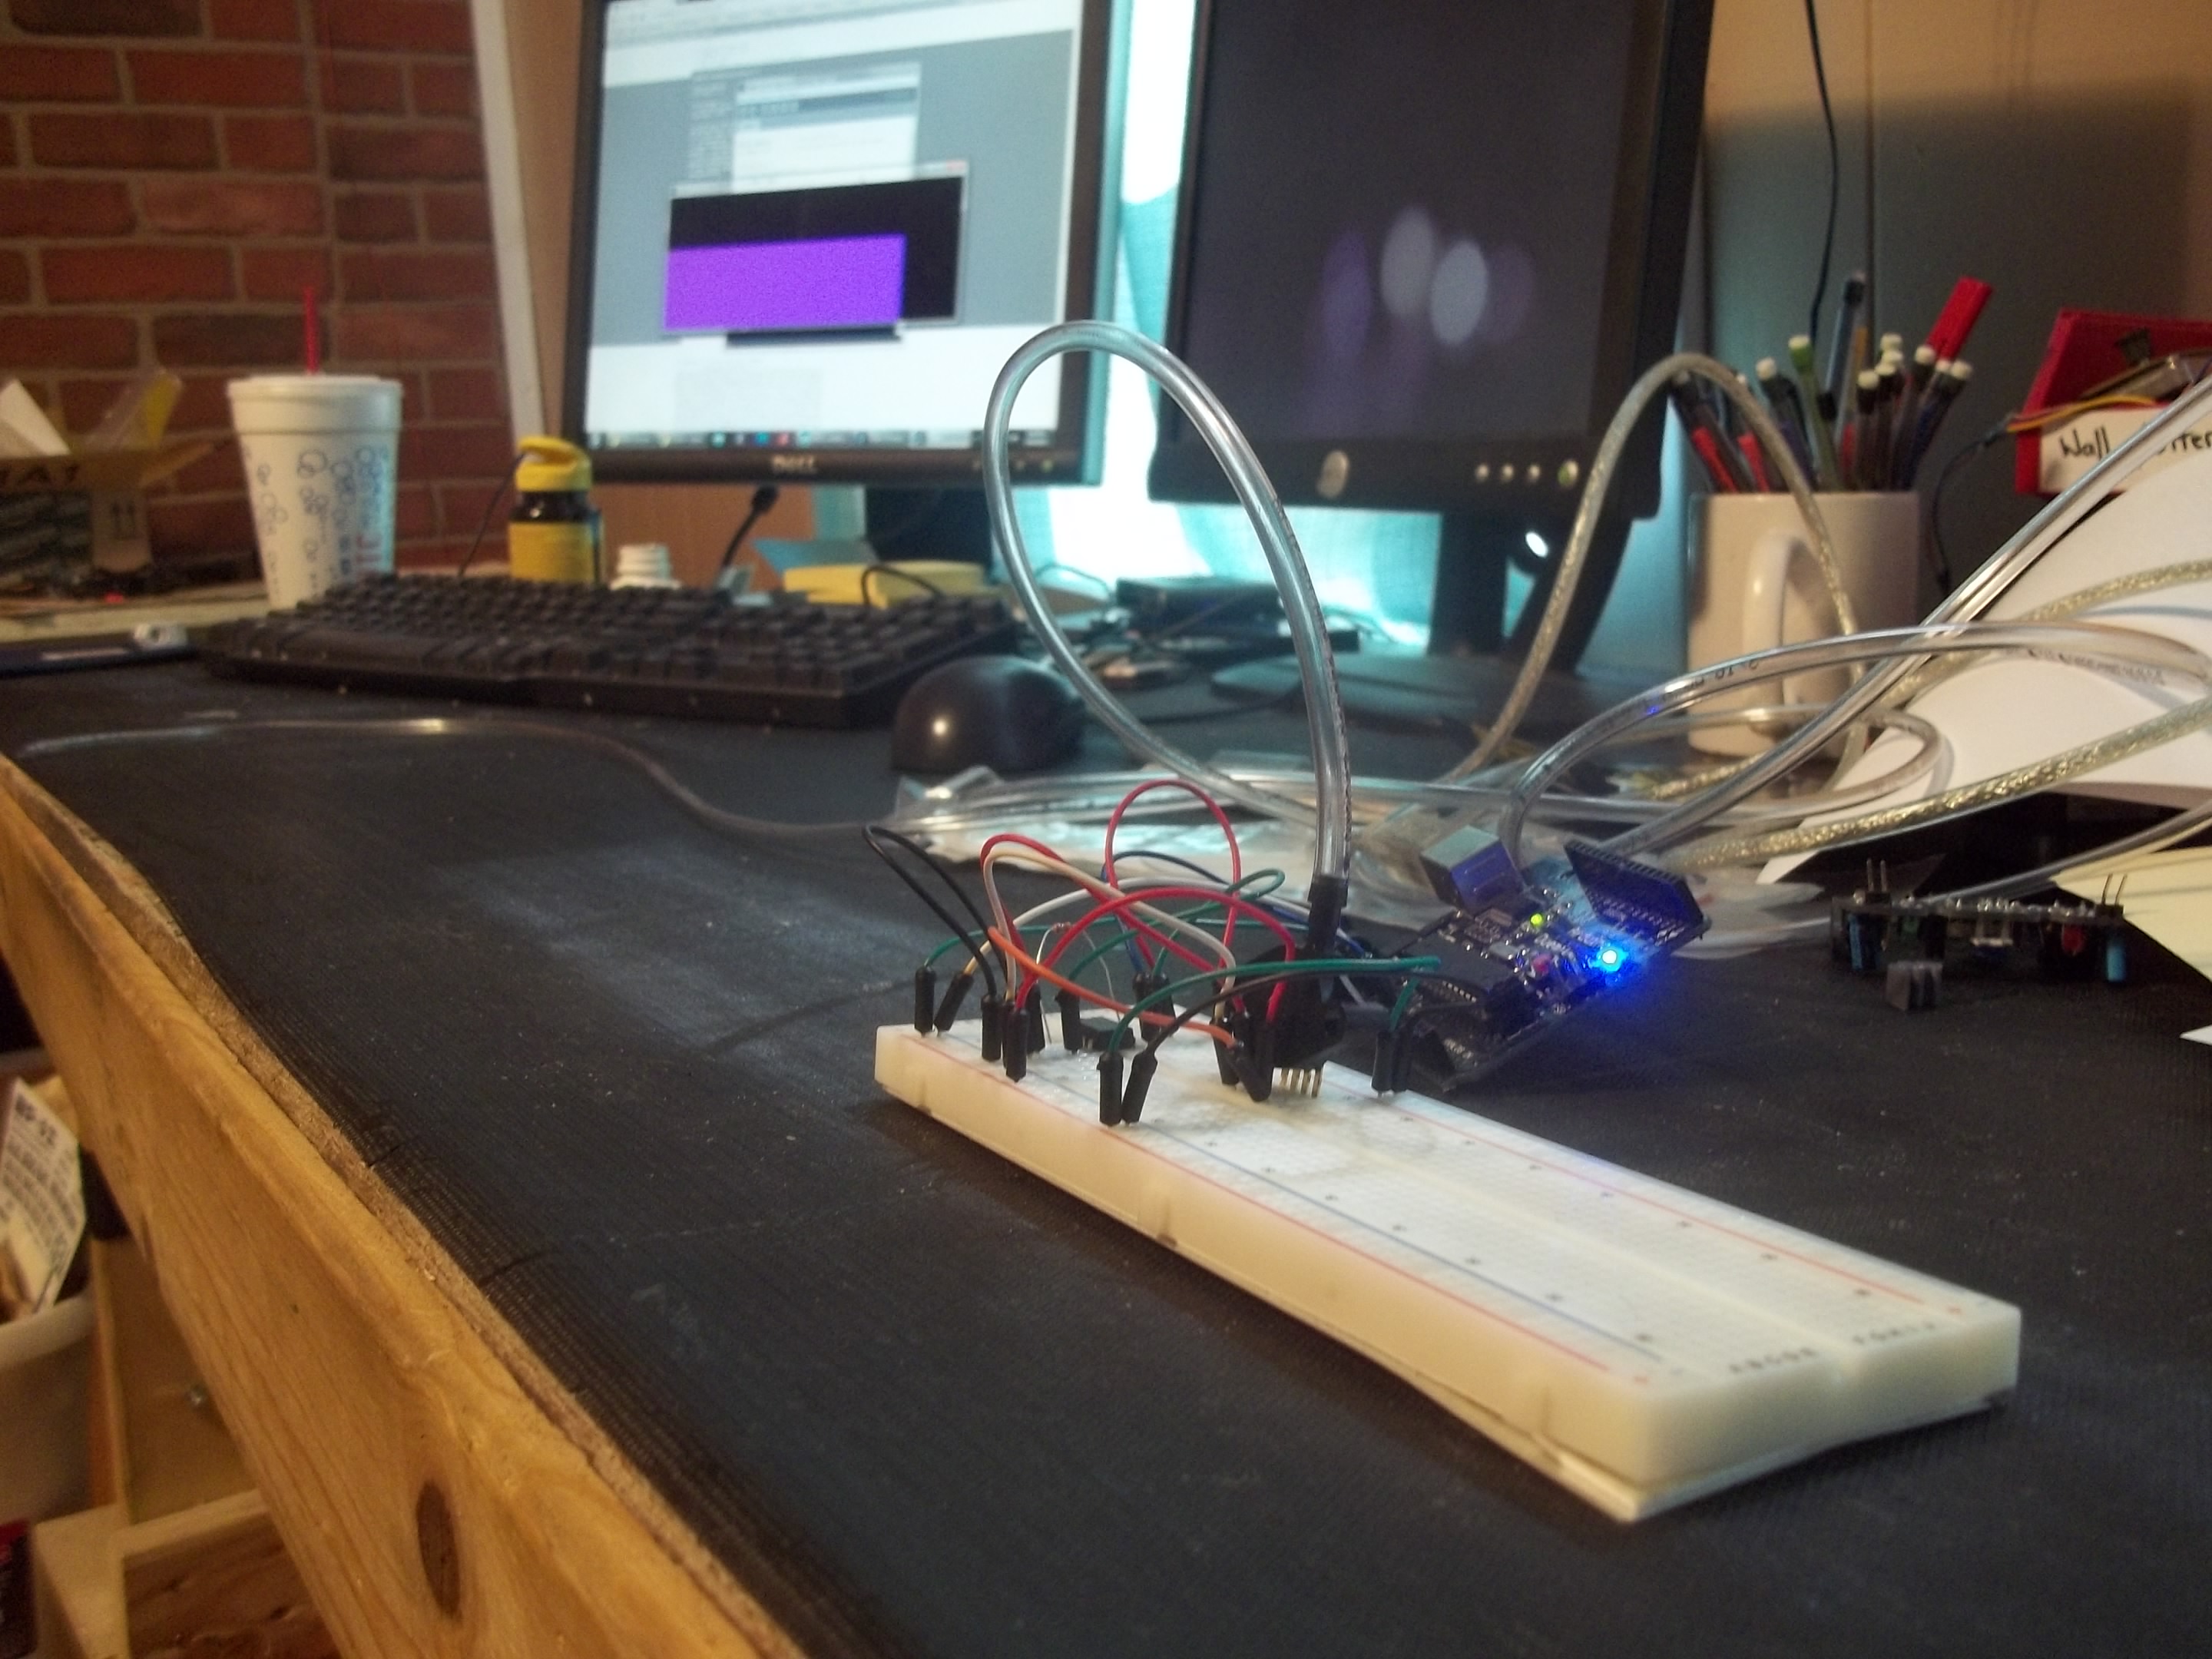
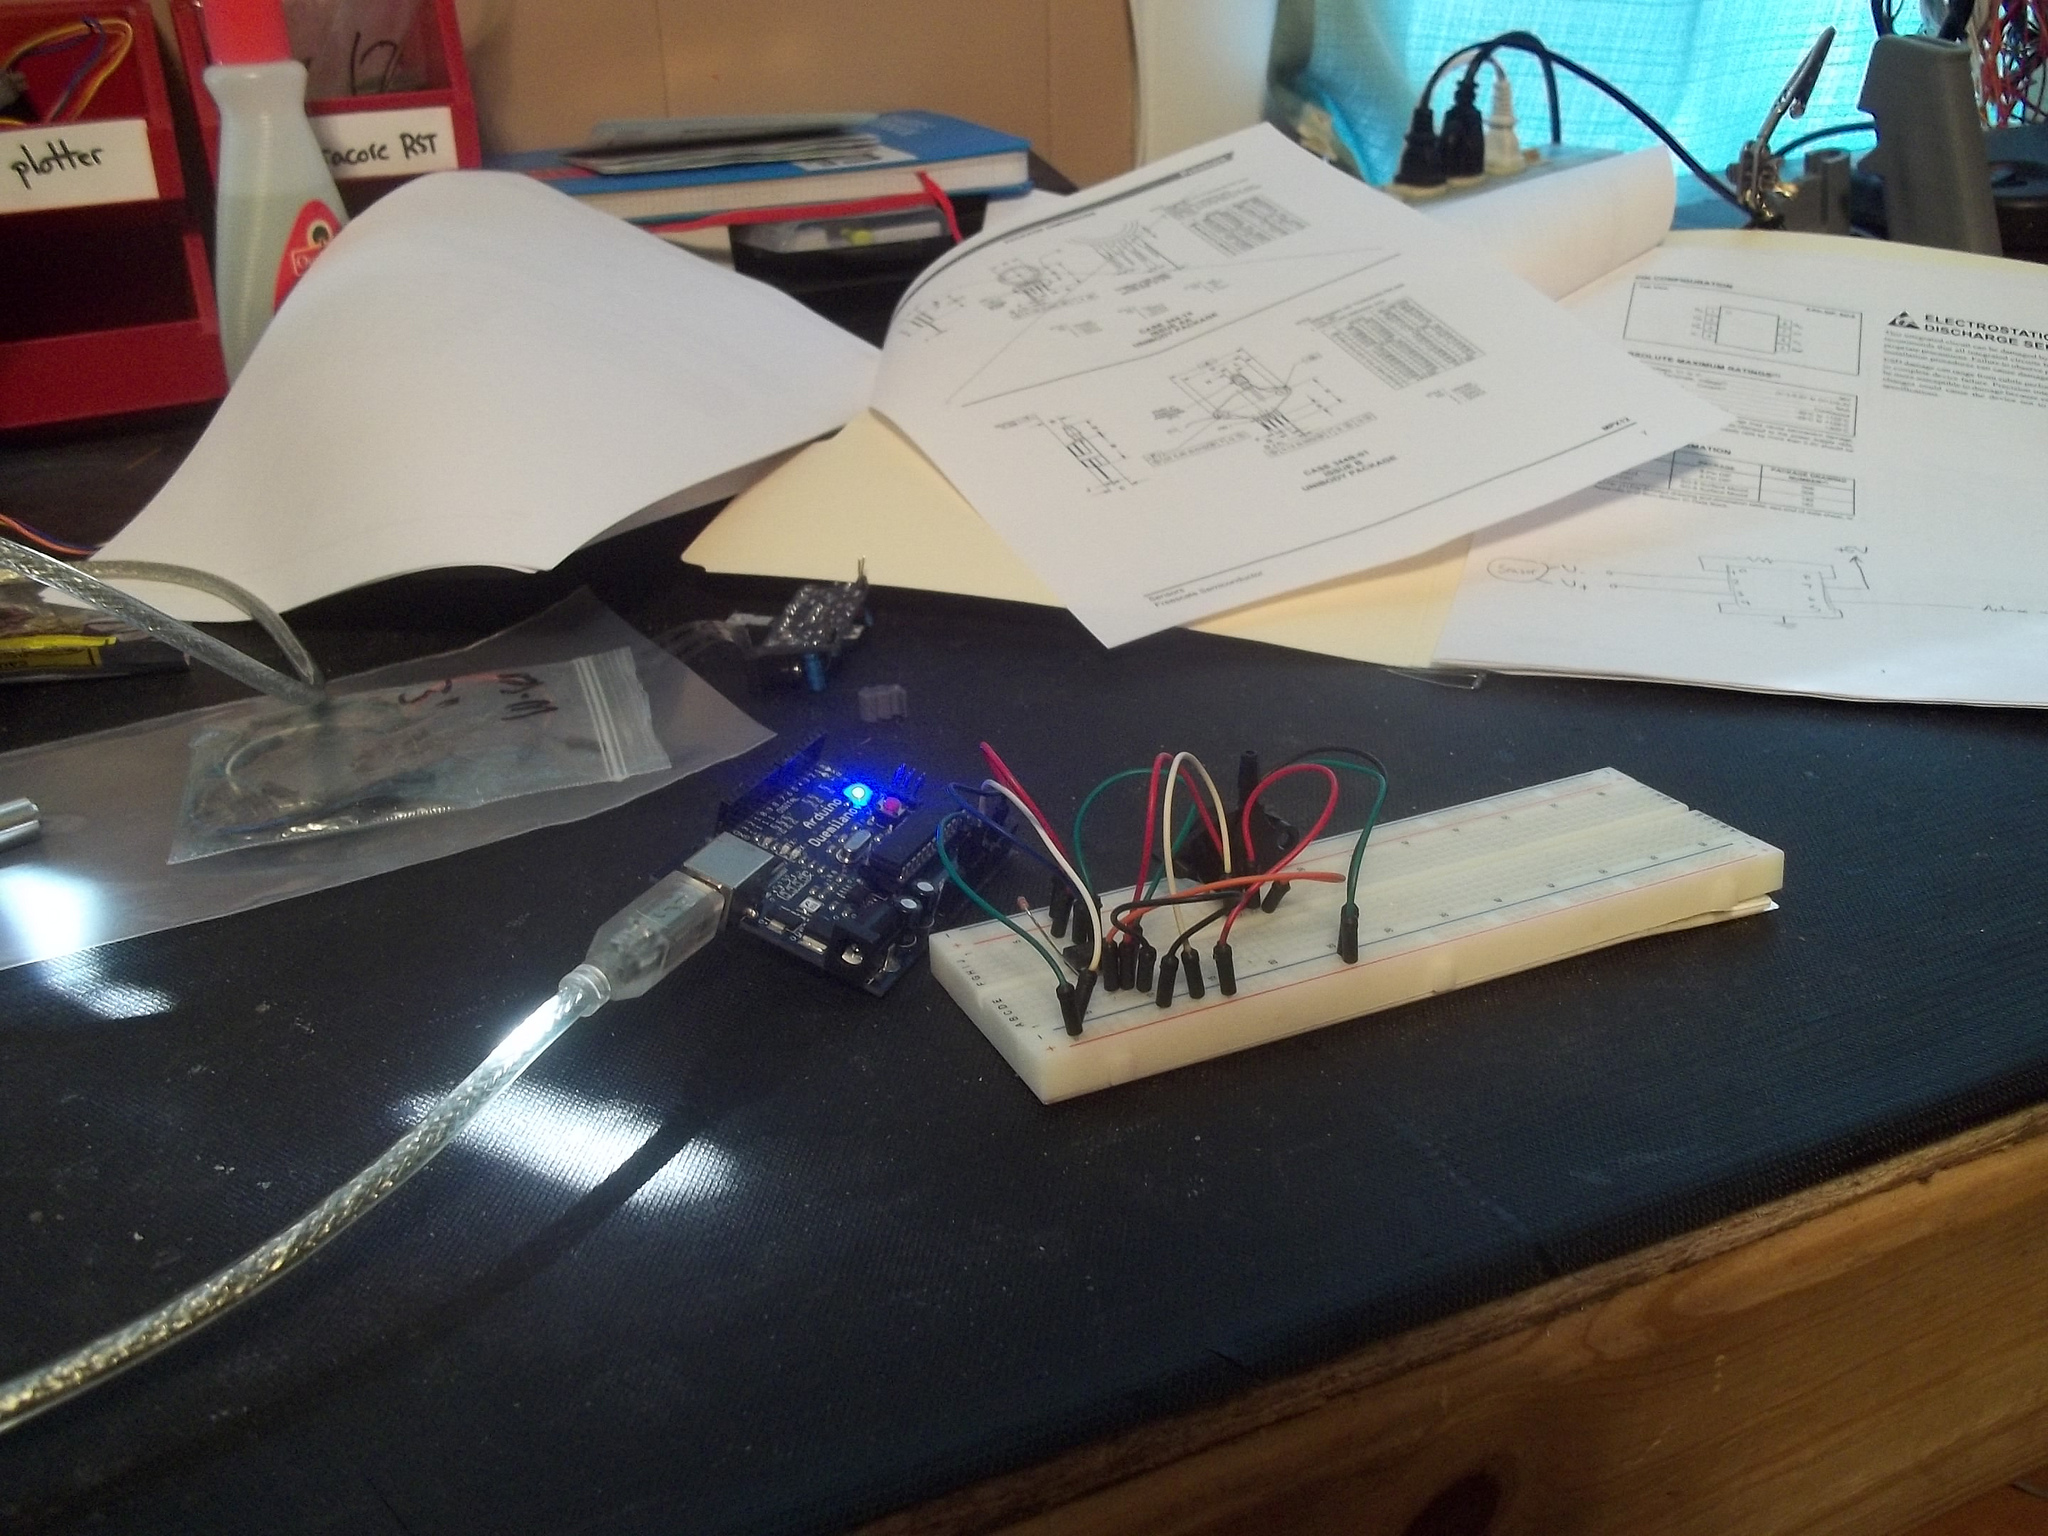
Working breadboard prototype of an open-source “sip and puff” interface
As part of a series of assistive technology projects for creative uses, I have been working on an open-source “sip and puff” interface that will ultimately be able to send expressive data to the user’s PC. My goal is to create a simple, adaptable and reconfgurable system that requires no programming or electronics experience to operate, so that typical users can get up and running (and actually making things) within a matter of minutes.
Choosing the sensor
 Originally I was planning to simply revive and touch up an existing “open-source” sip and puff project I found. However, despite saying that the project is open-source, there are no source files to be found. I got in touch with the author of the project, and he pointed me to the MPXV10GC7U as the sensor that he based his design on. From there I was able to find a similar sensor with a different package that would fit better into my overall design concept.
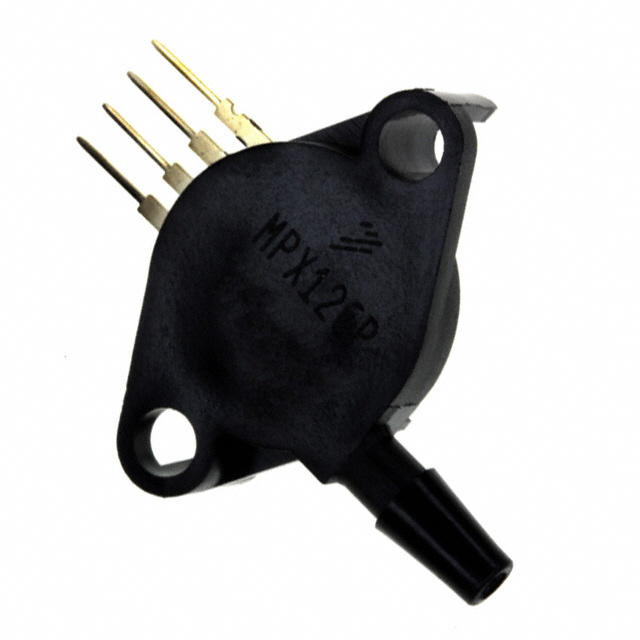
I settled on the MPX12GP, a differential gauge-type pressure transducer that can measure both positive and negative air pressure (puffing and sipping). The sensor can measure up to 1.45 PSI (~10 kPa) with corresponds nicely to the amount of air pressure that a human can make under normal conditions.
According to the datasheet, the sensor will output a voltage between ~20mV and 55mV depending on the amount of air pressure measured. The trick is reading that tiny voltage using the on-board ADC of an Arduino!
Interfacing with the sensor the wrong way
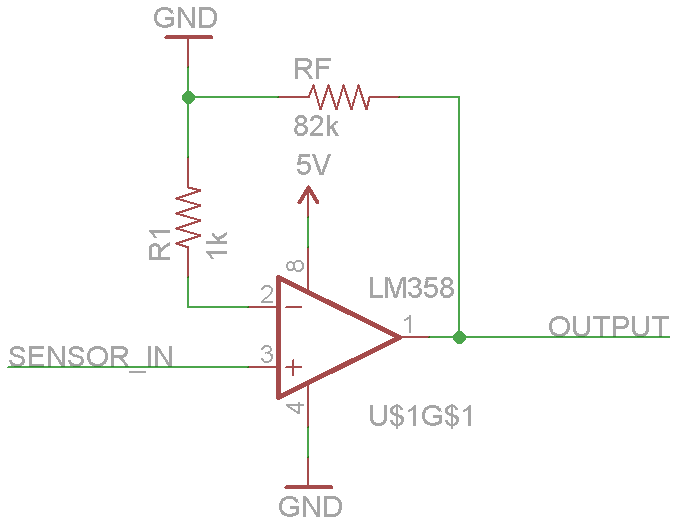 For whatever reason my first instinct was to try to amplify this signal using an op-amp configured as a non-inverting amplifier with a gain factor of about 90. The schematic for this type of interface can be seen on the left. However, it is not the right way to do this!
When I tried wiring everything up on a breadboard and measuring the output with a multimeter, I could only measure 2.5V at the output no matter what I did to the sensor for input. Turns out that a non-inverting amplifier is only good when you have a single signal you want to amplify. But this sensor actually has two signals (a “+” and a “-” output) that need to be used together to get the real output signal.
Interfacing with the sensor the right way
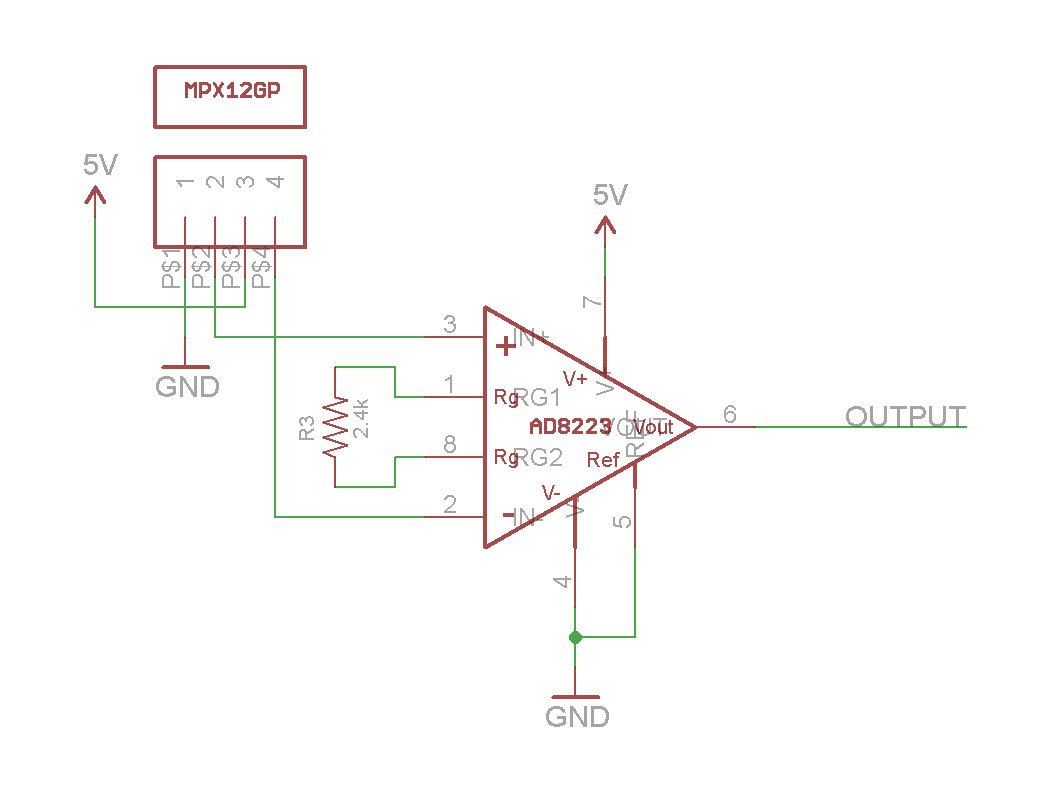
The correct way to interface with a sensor is to first find the difference between the two sensor outputs (“+” and “-“), then amplify the remaining signal. Each output will naturally float around 2.5V and will deviate from that voltage by that tiny voltage mentioned before (20mV-50mV), so the resulting signal will be very weak (only the deviation voltage). This small voltage is finally amplified and read by the Arduino as the usable signal.
All of this is actually handled by another type of op-amp configuration called an instrumentation amplifier. You can actually buy pre-made chips containing instrumentation amps so that all you have to do is plug in your sensor and add a resistor to configure the amplifier’s gain. The above schematic shows what this type of interface looks like. I’ve found two good instrumentation amps that fit the job perfectly, and are totally pin-compatible:
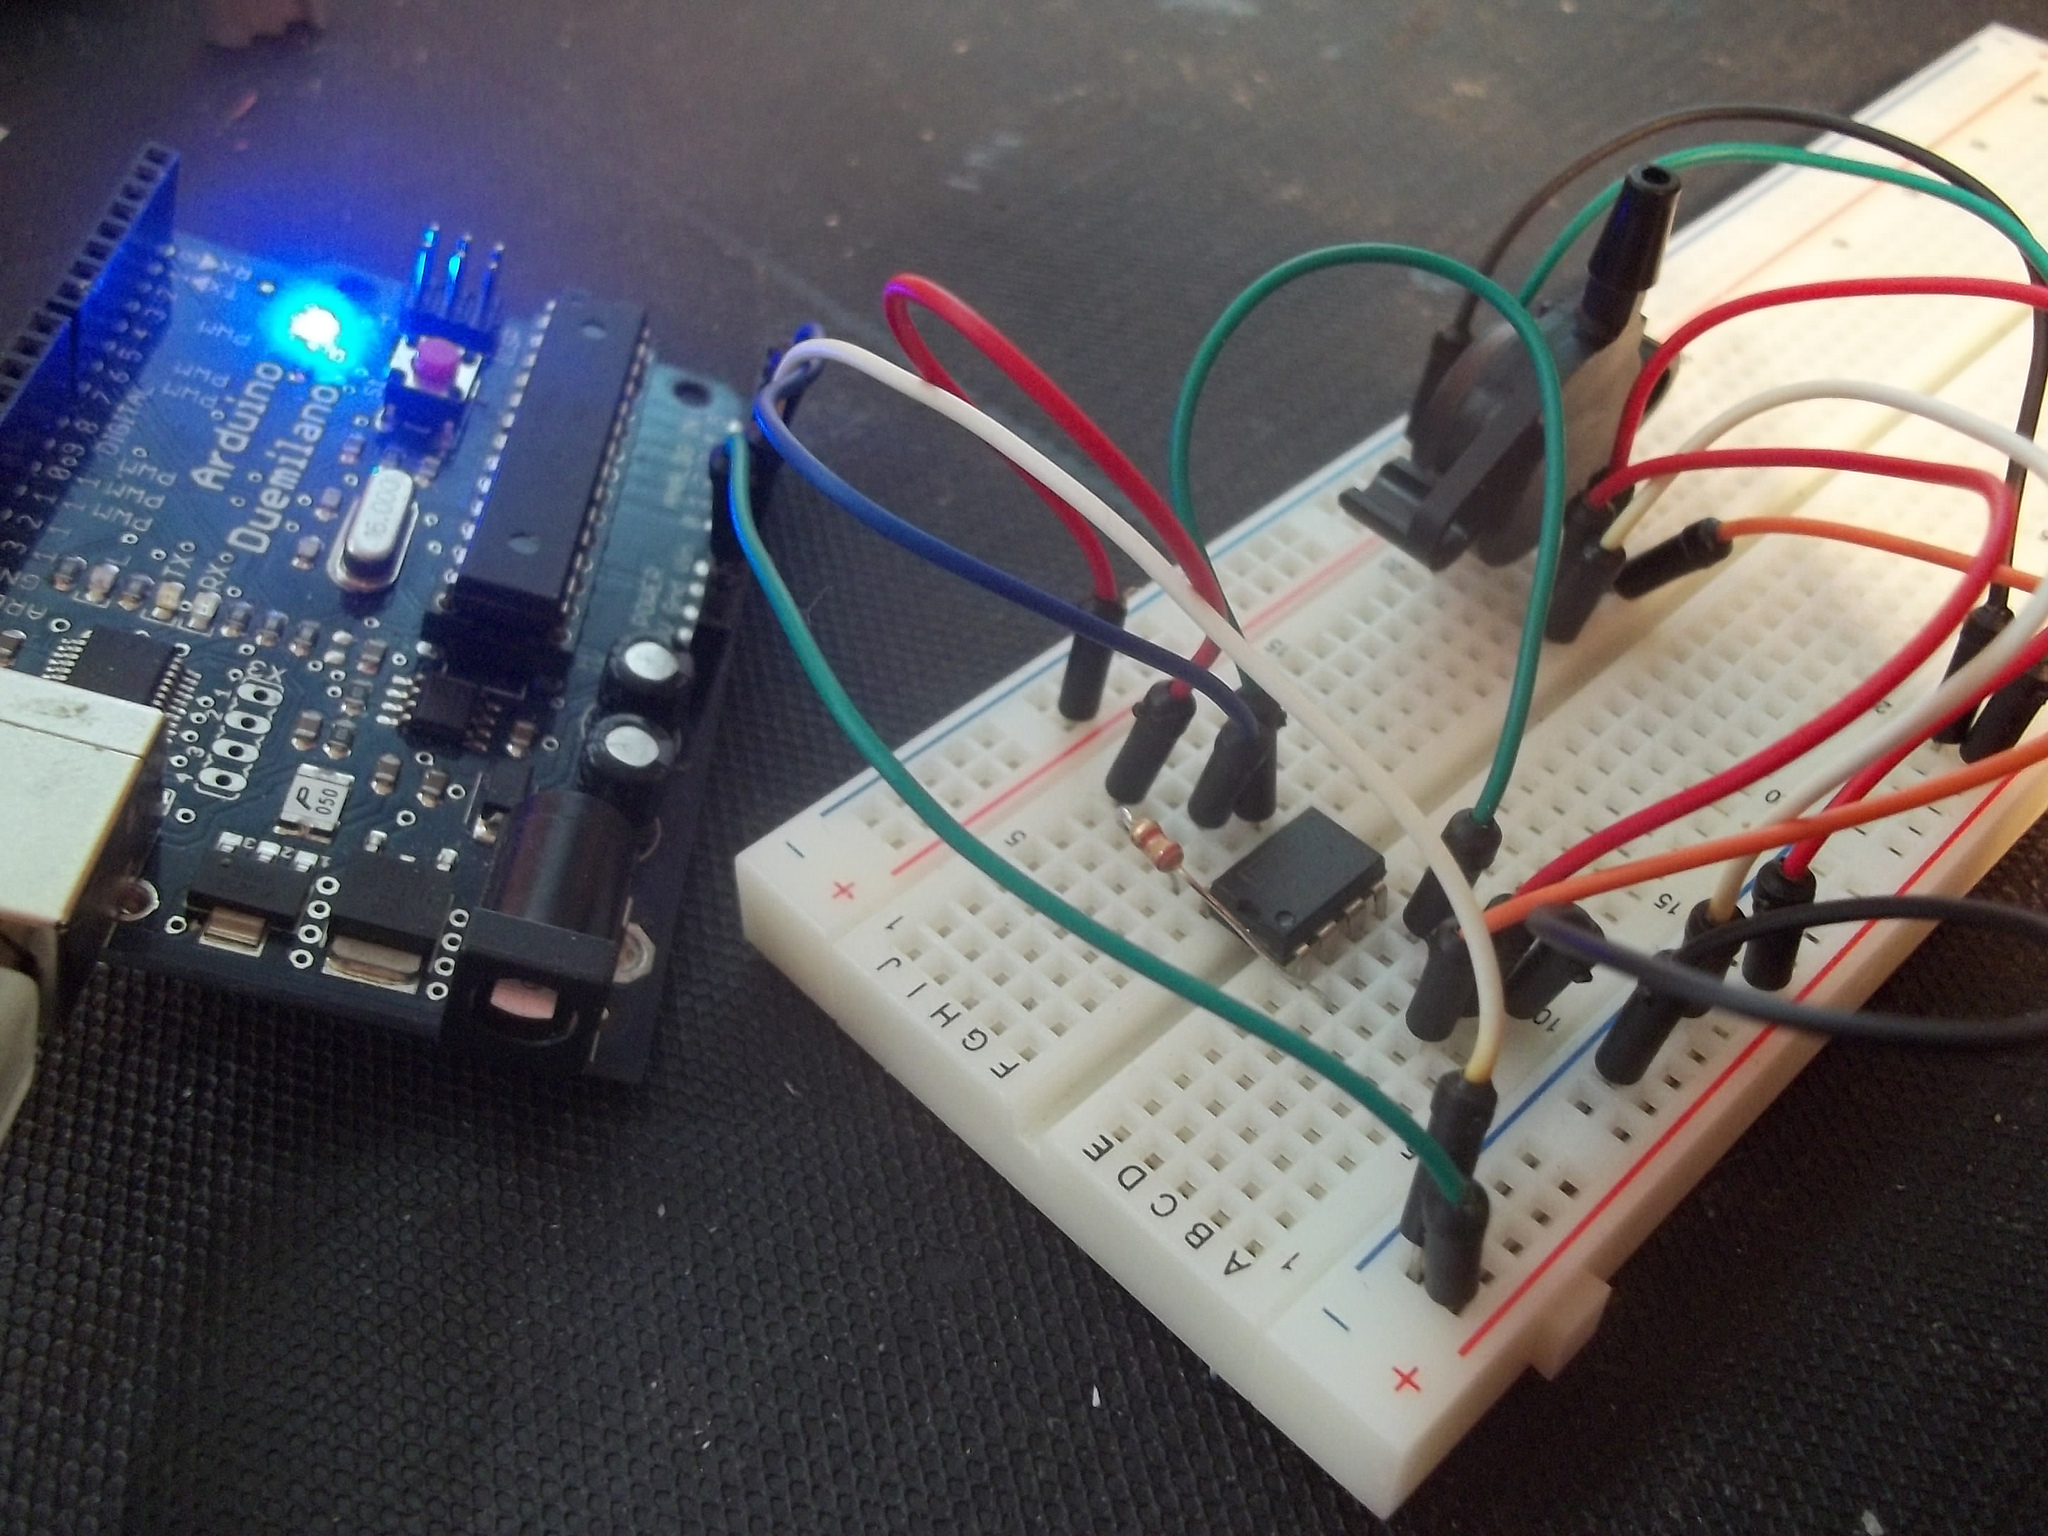
To test the interface, I picked up one of the INA122 chips and built the circuit on breadboard, then connected the output to an Arduino for measuring. Believe it or not, it worked perfectly the first time!

Sample data obtained from the interface
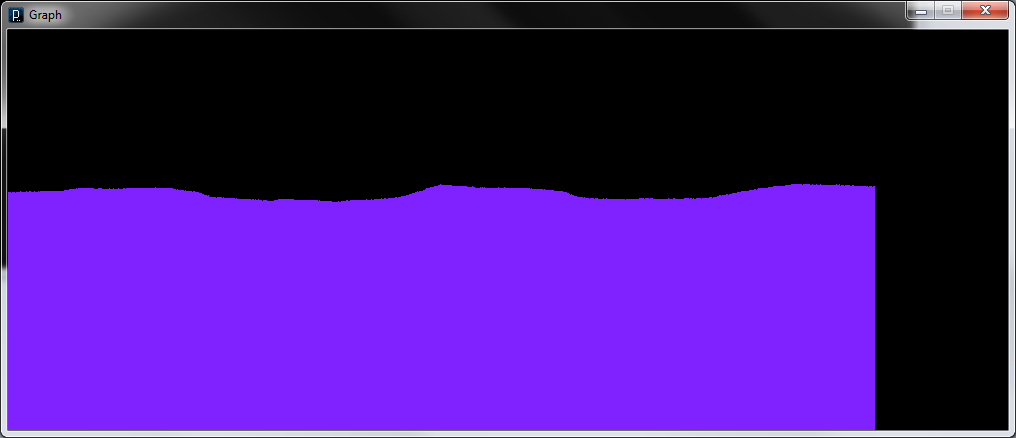
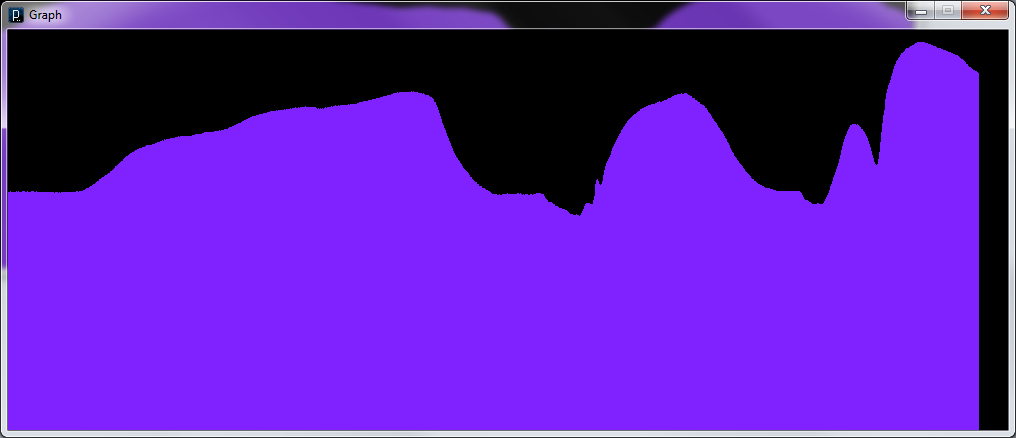
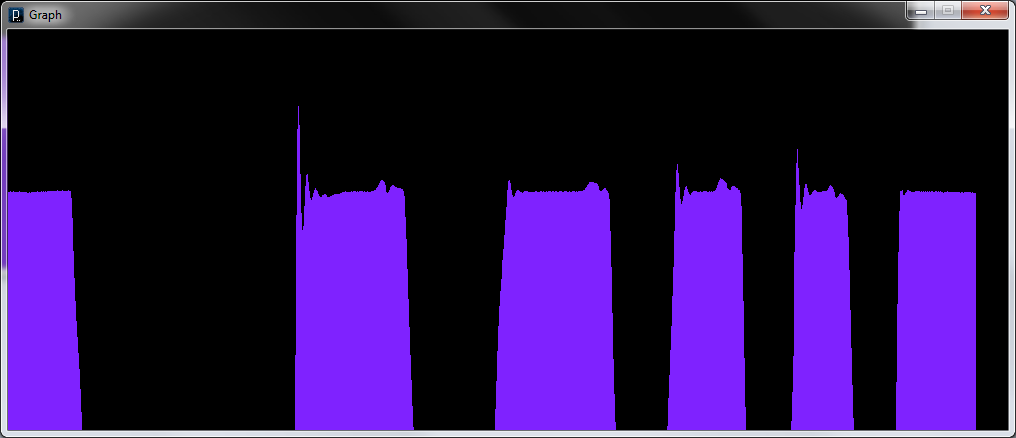
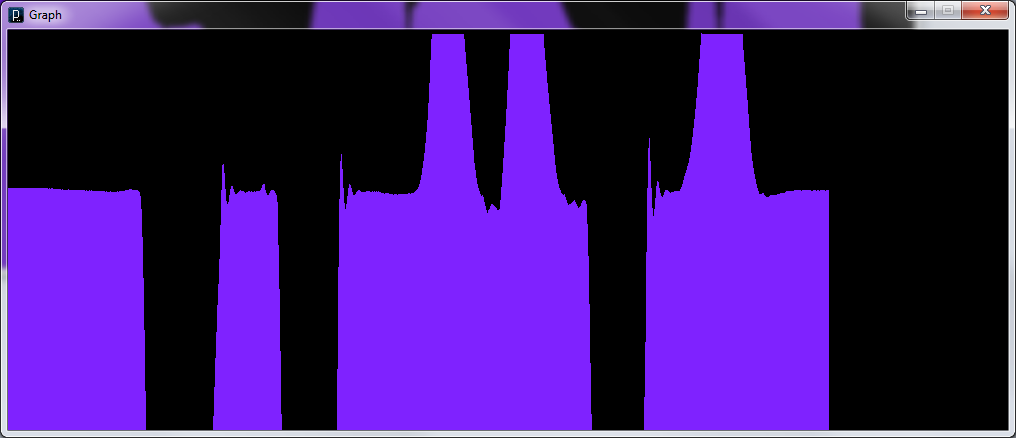
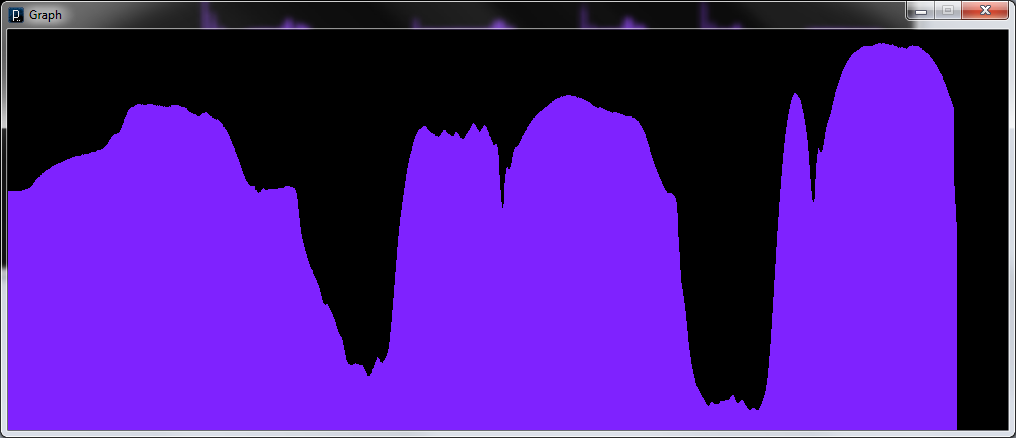
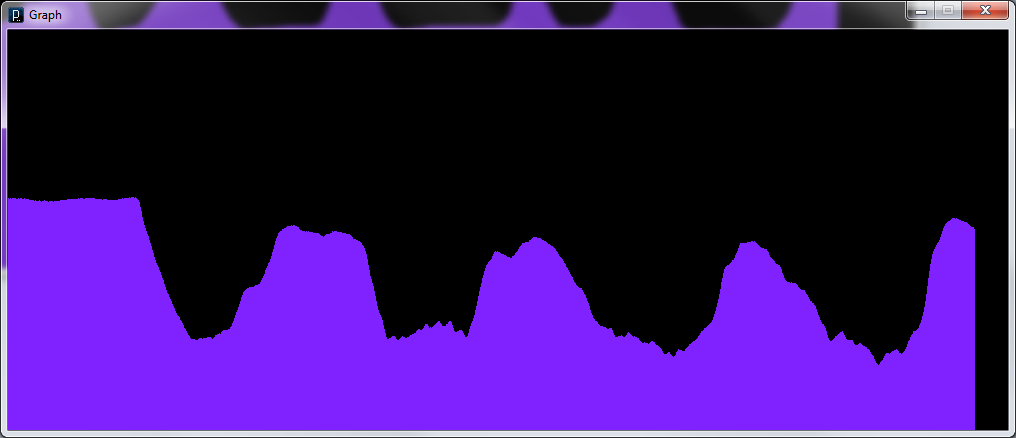
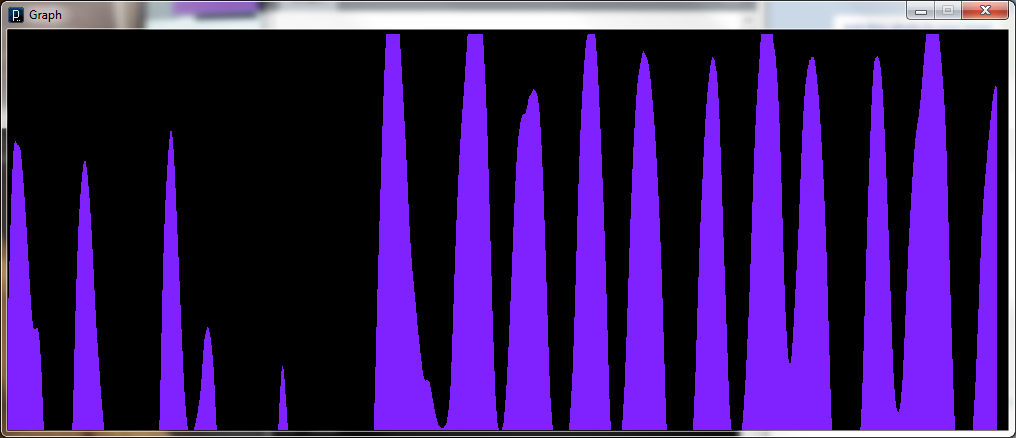
With the electronics up and running I ran a few tests with the sensor to see what the signal looks like when you sip and puff on it. I grabbed a 10ft length of ~3/16″ diameter vinyl tubing from a local hardware store and attached it to the sensor’s air port, then put together a “poor man’s oscilloscope” using an Arduino and a Processing sketch. The Arduino reads the sensor values through the instrumentation amp, then outputs a stream of data via Serial to be read and graphed by a simple Processing sketch. By watching how this graph changes as I sip and puff on the vinyl tube I can get a really good idea of what the data is looking like in real-time.
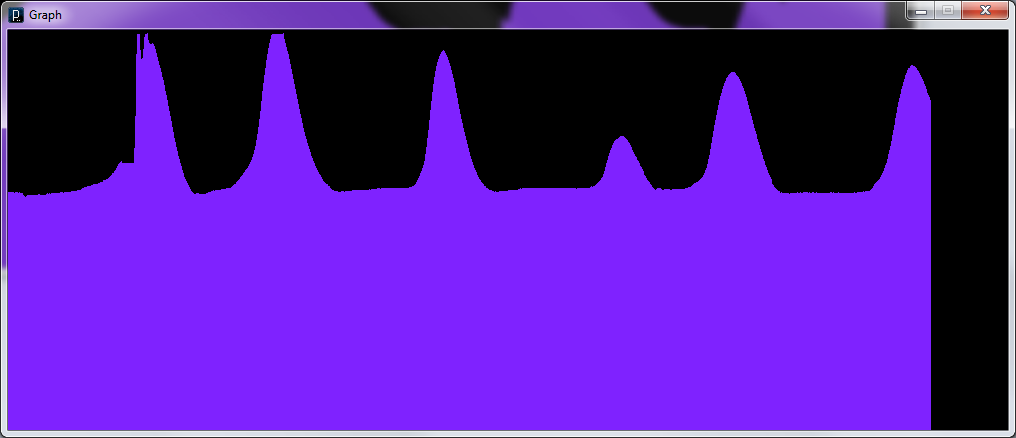
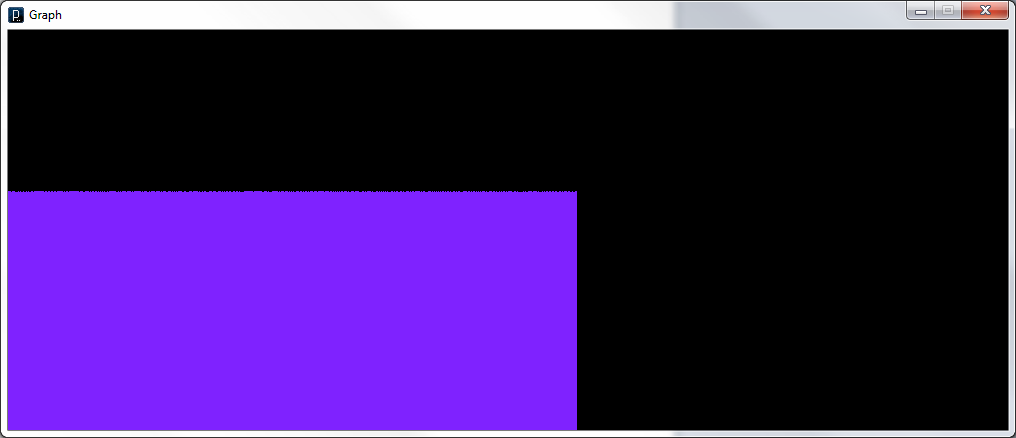
I was happily surprised by how stable, smooth and responsive the data from the sensor is. It can easily detect anything from light breathing to aggressive sipping and puffing! I tried everything I could think of and took screenshots of how the graph looked each time – click on each image to see what it represents!
Next steps
With the sensor interface circuit worked out, the rest of the device will be very easy to put together. I am planning to create a small PCB with this sensor interface connected to an ATMEGA32u4 loaded with the Arduino Leonardo bootloader. I’d like for the device to be capable of USB HID emulation so that it can output native keyboard, mouse and MIDI commands that user’s can use to control all sorts of activity on their computers.
I am also planning to build a 3D-printable clamshell case to mount this PCB inside of so that an average user can have a simple, attractive and cheap interface that they don’t have to treat too gently. Onward!